Scenario:
Let’s create a Virtual Kubernetes cluster with Grafana installed in it in just 60 seconds with Klusternetes(KNTS)
Introduction :
Grafana is a multi-platform open-source analytics and interactive visualization web application. It provides charts, graphs, and alerts for the web when connected to supported data sources.
Klusternetes is a platform that allows you to create a Kubernetes cluster in a few seconds. It also provides some of the leading DevOps tools as add-ons while creating your Cluster and provides a Service URL for add-ons that have UI.
Steps:
- Login to the klusternetes App. If you don’t have an account in the Klusternetes app check here to create one.
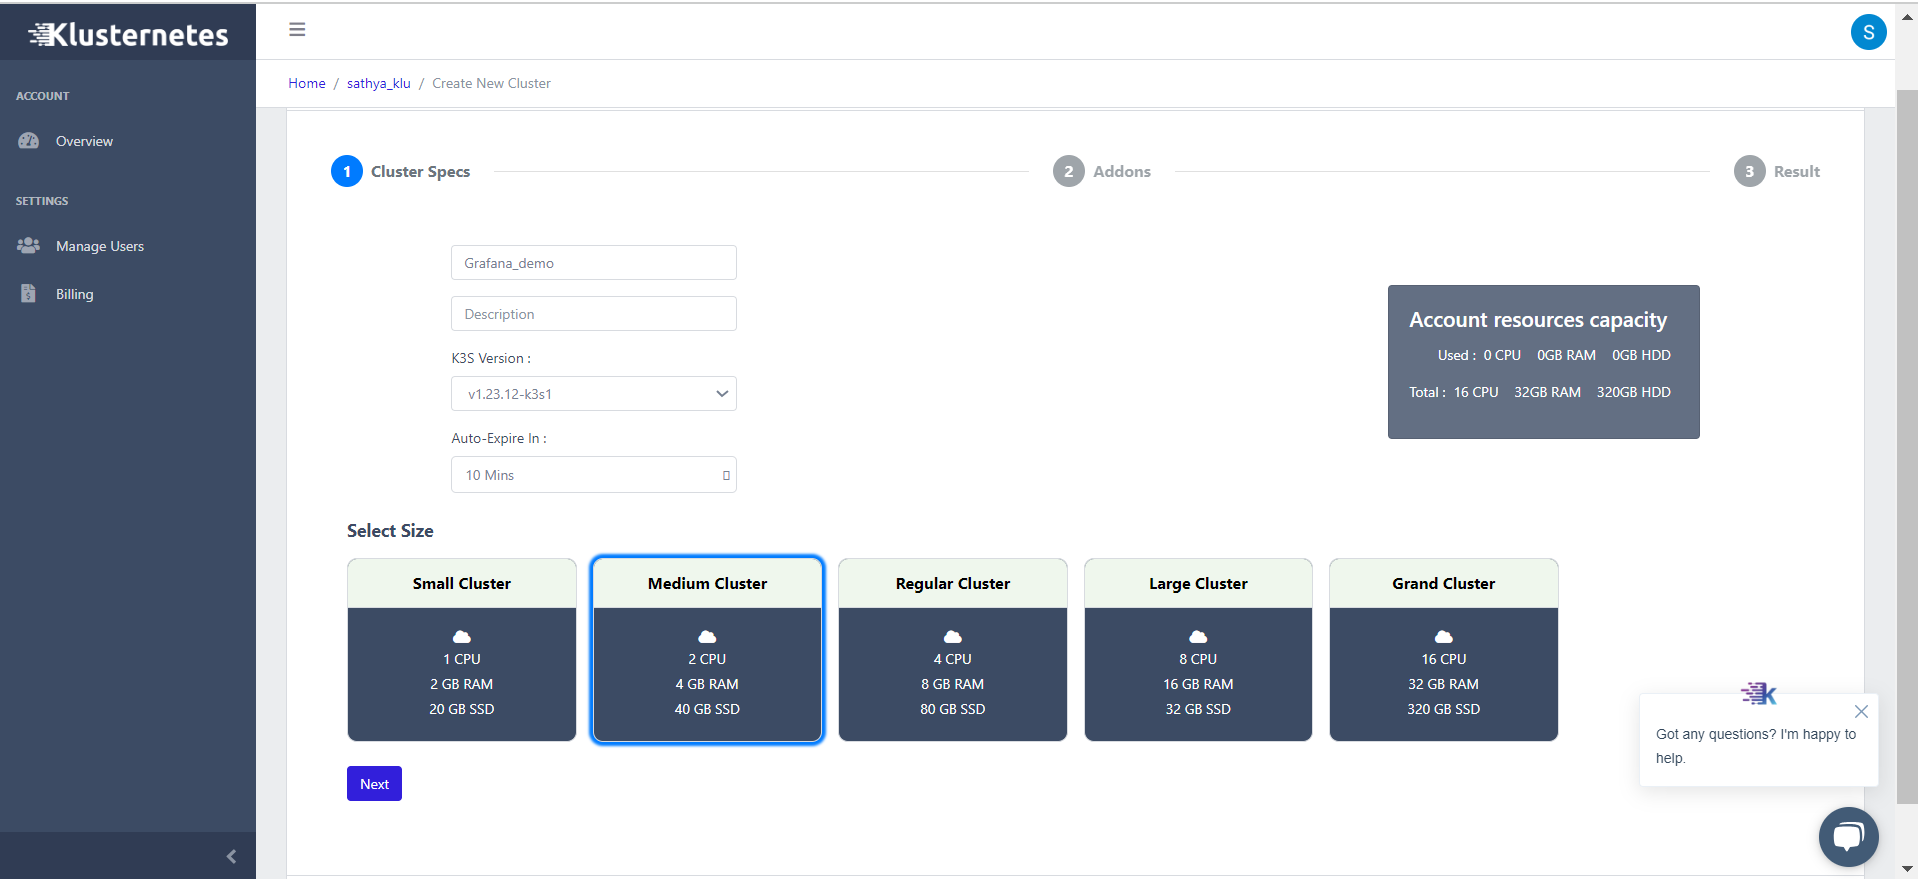
- Click “Add cluster” in the top right corner, leading you to a cluster creation page. Fill in the necessary fields and select a medium cluster and click next.
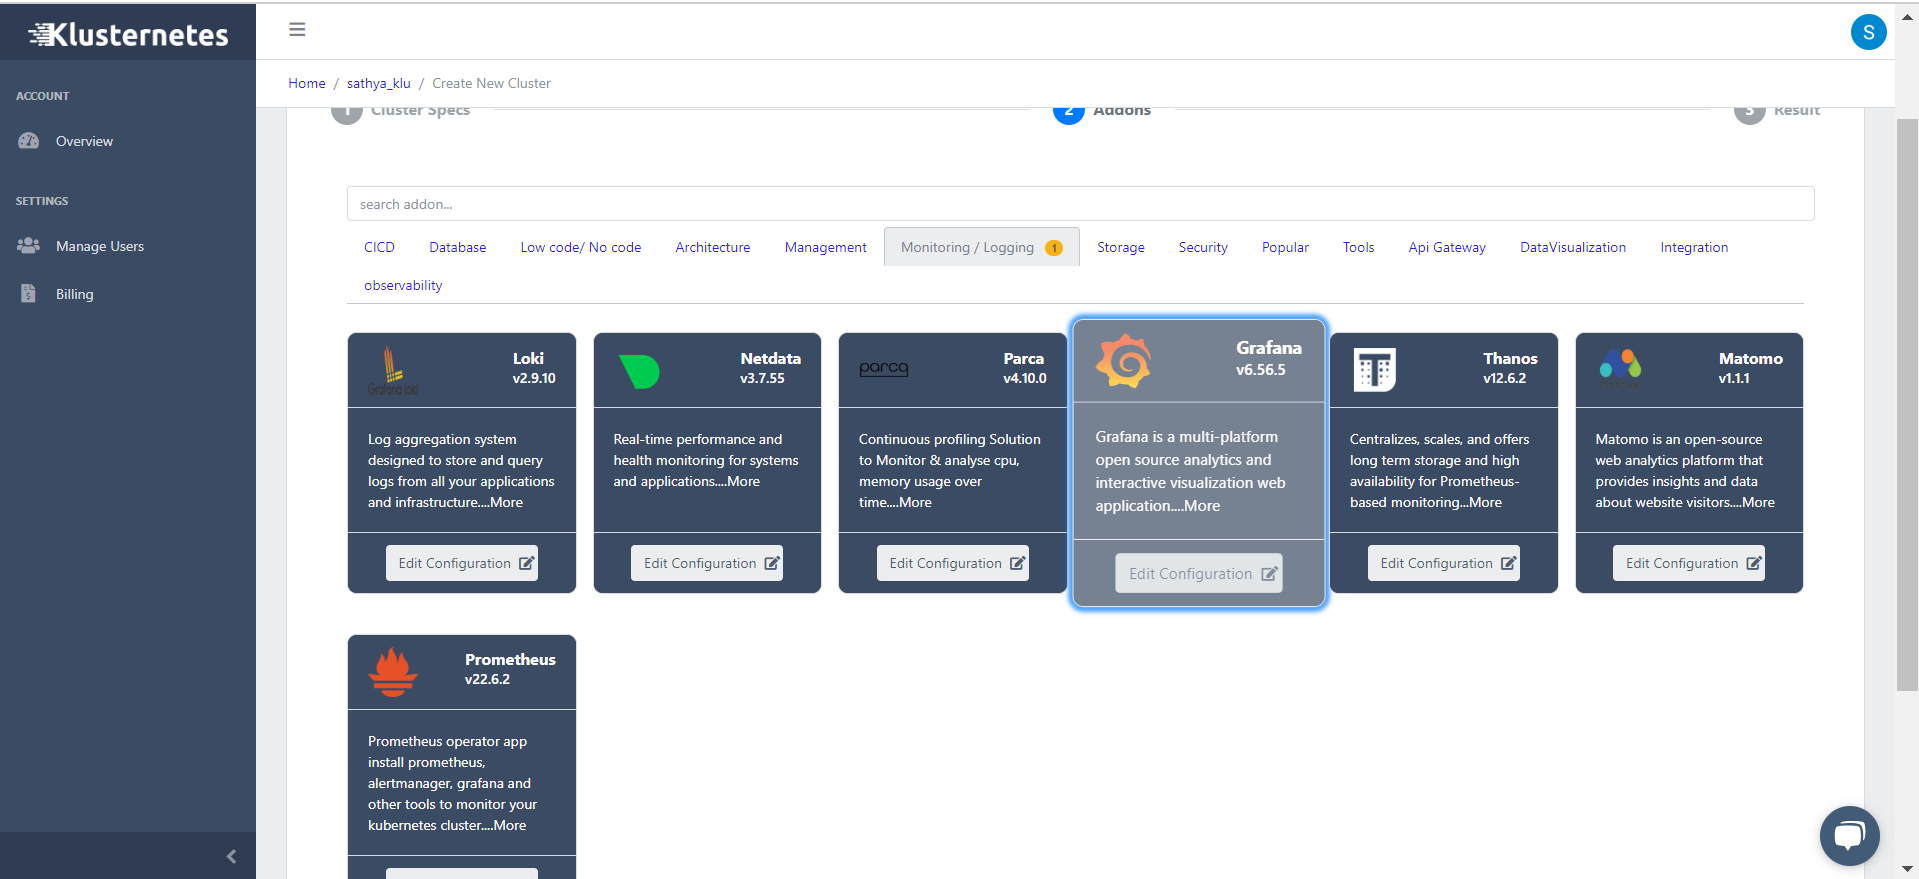
- It will lead you to the Features page, go to the Monitoring / Logging section and select Grafana.

- Here comes the best feature of Klusternetes, we can edit the configuration of the add-ons. So, now click on “Edit configuration”
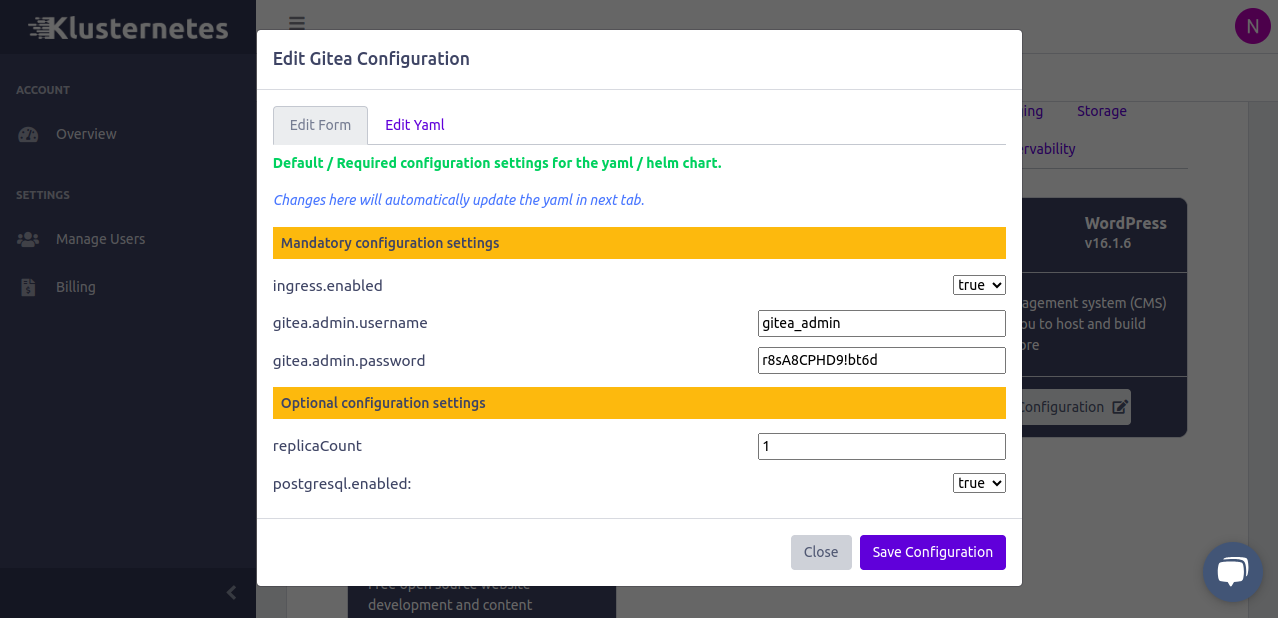
- You can change the ingress.enabled, service.type, and replicas. If you want to edit more configurations you can click on Edit YAML at the top and can edit the field which you want.
- After editing the config, click on the “Save configuration” button and then click on the “Submit” Button.
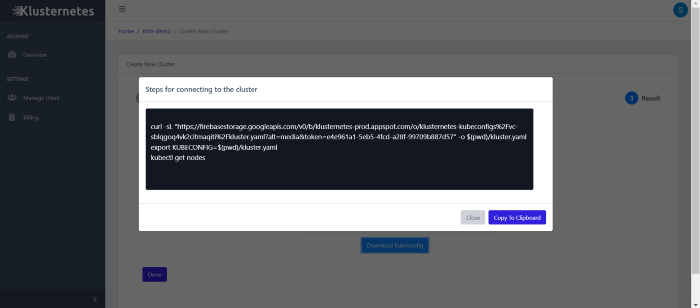
- That’s it; you created a Klusternetes cluster with Grafana installed in it. Now you can download the kubeconfig of the cluster by clicking on the download button. It will show you the command’s to download.
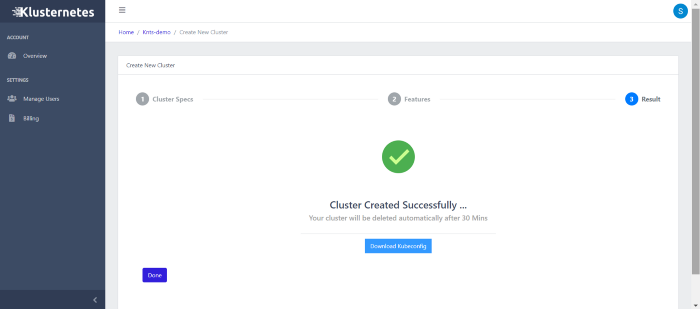
- You can get the download option even on your cluster list page. Click on “Done”. Now you will be on the main page of your account.

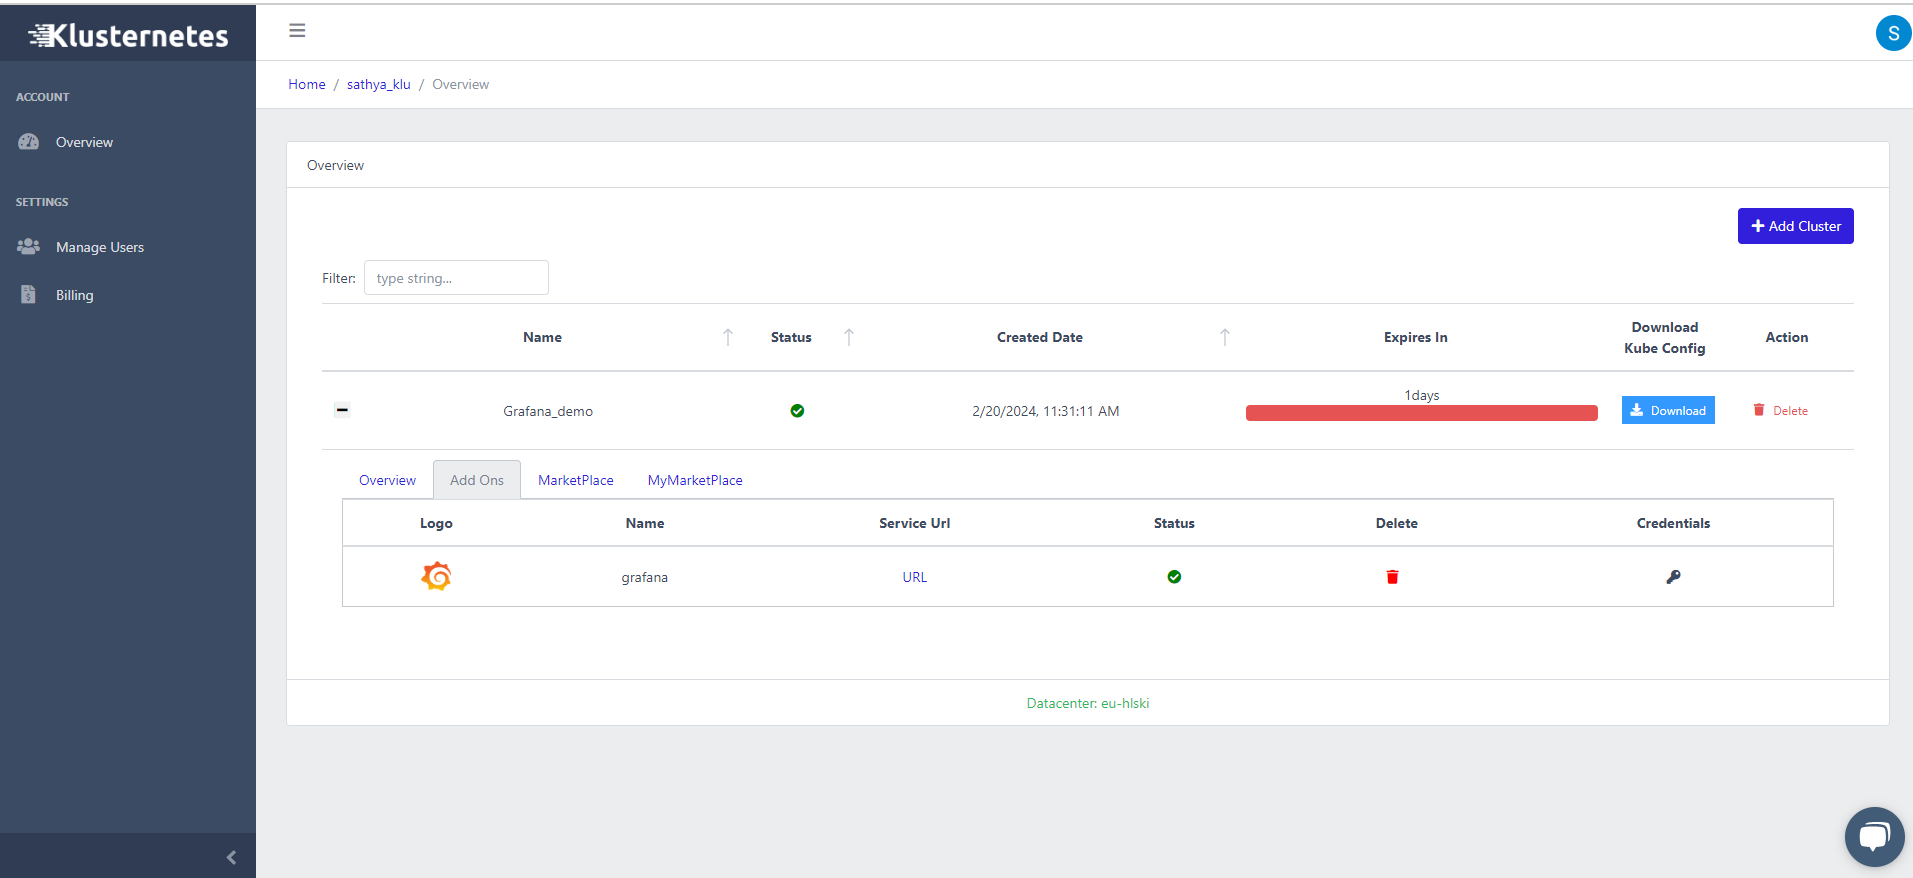
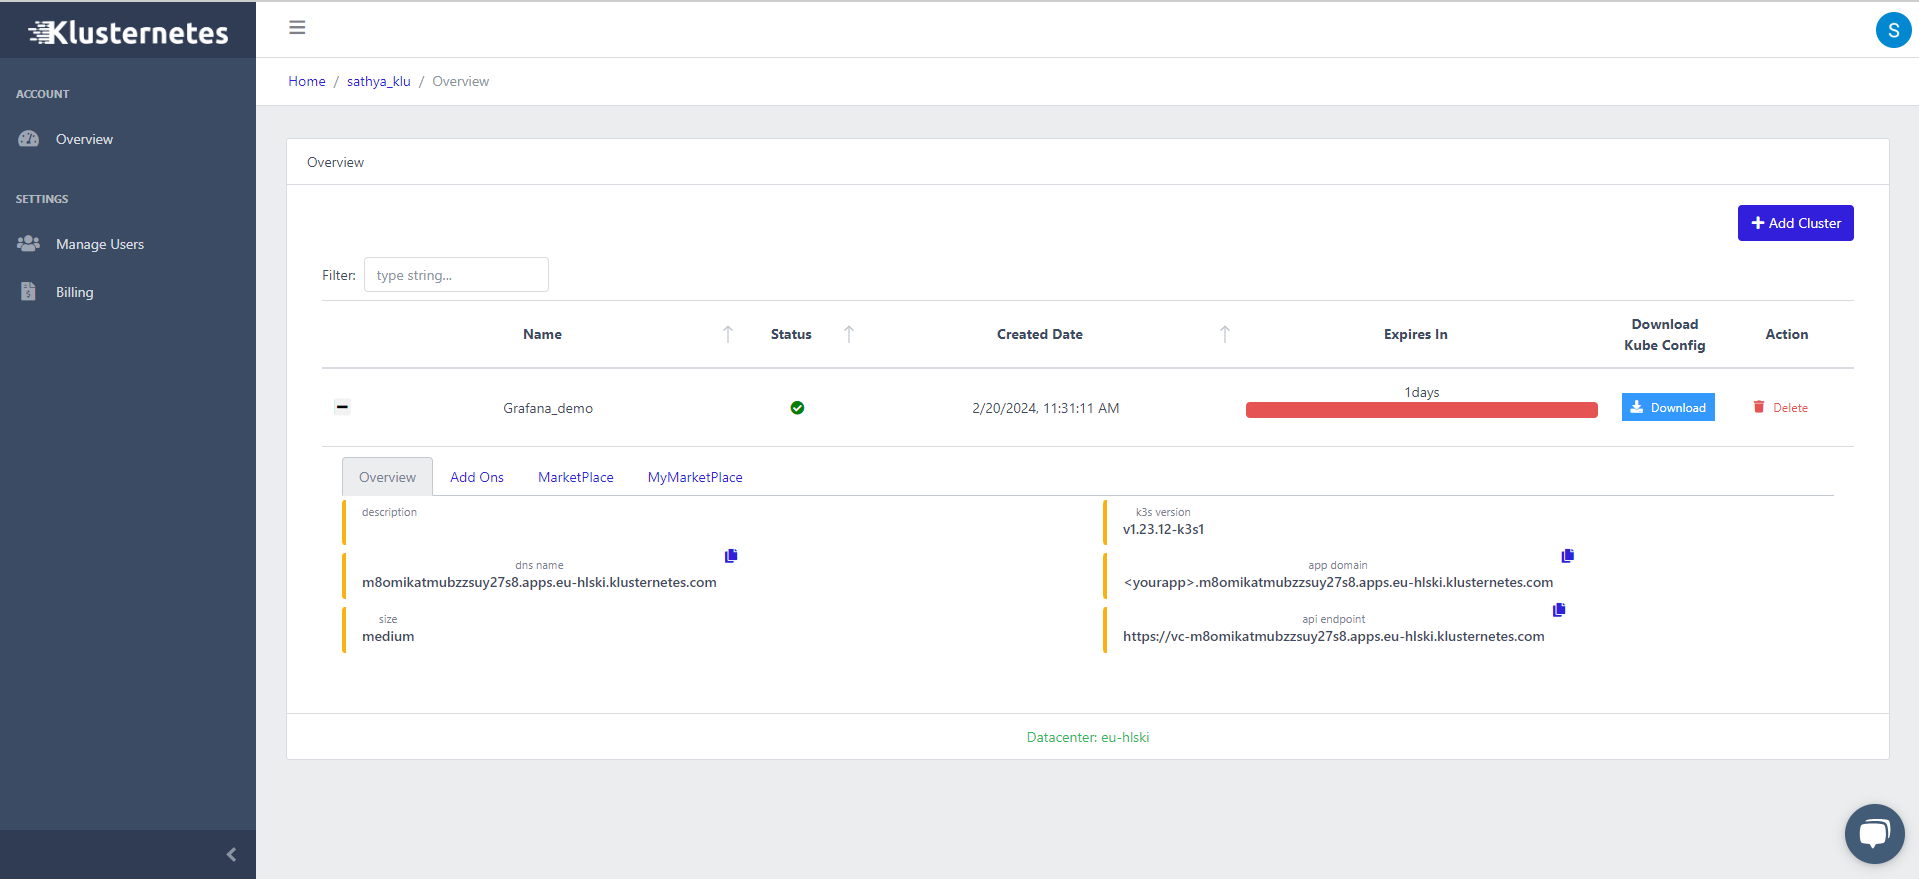
- Here is the list of clusters that you created and information about your cluster. You can even see the “Service URL”.
- Click on the “+” icon near your cluster to see two columns. One is for an overview of the cluster, and the other is for Add-ons.

- You can get the Service URL and the add-on status in Add on the column.
For log in, use admin as the user name. To get the password use the following command.
kubectl get secret grafana -o jsonpath="{.data.admin-password}" | base64 --decode ; echo
Summary:
So, that’s how you can spin up a cluster with Grafana within 60 seconds. Klusternetes also provide a lot of add-ons and is easy to understand.


